
 Whatsapp
Price Ceiling, Price Floor and Rationing: Graphs Explained
Understand binding price controls with labelled graphs, shortage and surplus calculations, rationing examples, government purchases and practice answers.
- 12th
- Economics

Imagine a shop with 60 packets of rice and customers who want to buy 120 packets. A notice promises a low price. That helps the people who get rice, but the notice cannot fill the empty shelves.
Now picture the opposite: sellers offer 140 packets, while customers want only 80 at the announced price. A higher price per packet does not guarantee that every packet will sell.
These two scenes capture the difference between a binding price ceiling, which creates a shortage, and a binding price floor, which creates a surplus in the usual demand-and-supply model. The word binding is essential. Before calculating anything, compare the legal limit with the market’s equilibrium price.
We will use one imaginary rice market throughout, then practise with a second market. All prices and quantities below are classroom examples, not current policy rates.
The definitions you need before drawing
A price ceiling is a maximum permitted price. A price floor is a minimum permitted price. Equilibrium is the price and quantity at which buyers’ and sellers’ plans match. These definitions follow the Federal Reserve Bank of St. Louis explanation of prices and price controls.
Suppose the equilibrium price is Rs 50 per packet:
| Rule | Is Rs 50 still allowed? | Outcome in our model |
|---|---|---|
| Maximum price Rs 40 | No | Binding ceiling |
| Maximum price Rs 60 | Yes | Non-binding ceiling |
| Minimum price Rs 60 | No | Binding floor |
| Minimum price Rs 40 | Yes | Non-binding floor |
A ceiling is named after the direction it blocks: prices cannot go above it. A floor blocks prices from going below it. Neither name tells you where to draw the line relative to equilibrium until you know whether the rule is binding.
If the limit equals Rs 50, the original equilibrium remains possible. It produces no shortage or surplus in this unchanged market. Some textbooks describe this boundary case differently, so explain the outcome rather than relying only on a label.
Our rice market: establish the starting point
Let P be rupees per packet. Qd and Qs are packets per day that buyers want to purchase and sellers want to supply at that price.
Qd = 200 - 2P
Qs = 4P - 100
Use these equations only over the relevant range where quantities are non-negative. For this example, prices from Rs 25 to Rs 100 meet that requirement.
At equilibrium, Qd = Qs:
200 - 2P = 4P - 100
300 = 6P
P = Rs 50
Substitute into either equation:
Qd = 200 - 2(50) = 100 packets per day.
Check the other side: Qs = 4(50) - 100 = 100 packets per day.
This matching-plans approach is explained in NCERT’s Market Equilibrium chapter. Our numbers are chosen separately so we can trace every later result back to the same market.
| Price per packet | Qd per day | Qs per day | Comparison |
|---|---|---|---|
| Rs 40 | 120 | 60 | Buyers want 60 more than sellers offer |
| Rs 50 | 100 | 100 | Plans match |
| Rs 60 | 80 | 140 | Sellers offer 60 more than buyers want |
The last column measures a gap between plans. It does not mean that all those packets actually change hands.
Binding ceiling: read a shortage horizontally
Set a maximum price of Rs 40. Since 40 is below 50, the ceiling prevents the original equilibrium price.
At Rs 40:
- Quantity demanded = 200 - 2(40) = 120 packets.
- Quantity supplied = 4(40) - 100 = 60 packets.
- Shortage = Qd - Qs = 120 - 60 = 60 packets per day.
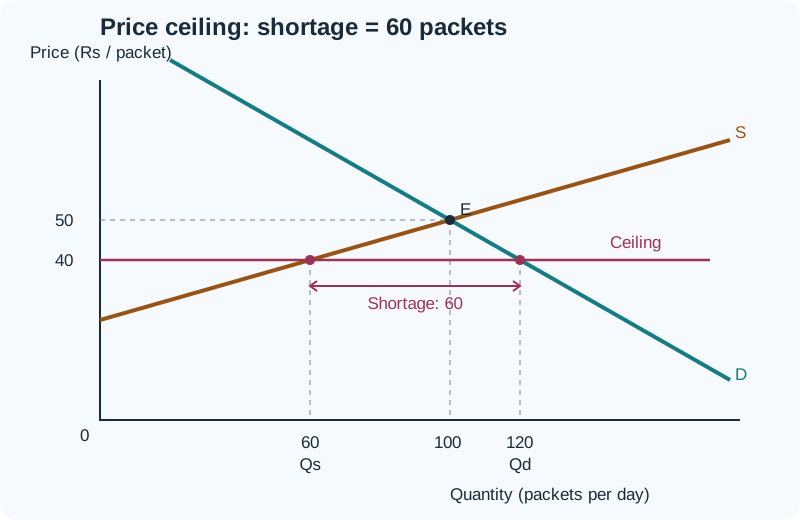
To reproduce this diagram:
- Label the vertical axis price per packet and the horizontal axis packets per day.
- Draw downward-sloping D and upward-sloping S.
- Mark their intersection E, with price 50 and quantity 100.
- Draw a horizontal ceiling line through price 40.
- Read its intersection with S first: Qs = 60.
- Read its intersection with D: Qd = 120.
- Mark the horizontal gap as shortage = 60.
Do not measure the vertical difference between Rs 50 and Rs 40 and call it a shortage. That is a price difference of Rs 10. The shortage is a quantity difference of 60 packets.
How much rice is actually sold?
Under the simplified assumption that all available supply reaches willing buyers, legal sales are 60 packets, the smaller quantity. Buyers wanting 120 cannot purchase 120 when only 60 are supplied.
Compare three separate numbers:
| What the question asks | Answer |
|---|---|
| Quantity demanded at the ceiling | 120 packets |
| Quantity traded at the ceiling, under our assumption | 60 packets |
| Shortage at the ceiling | 60 packets |
| Fall in trade compared with equilibrium | 100 - 60 = 40 packets |
The shortage and the fall in trade are different. Their equal-sounding descriptions are a common source of wrong answers.
Rationing: distribute the available stock
With only 60 packets available in our example, someone must decide who receives them. Here, rationing means an organised rule limiting purchases or allocating a fixed stock, such as household entitlements or coupons. The broader economic use of the word includes allocation through prices too.
Suppose 30 eligible households each receive permission to buy two packets that day:
30 households × 2 packets = 60 packets.
The entitlements fit the available stock exactly. If every household takes its allowance, the shop distributes all 60 packets.
But a coupon is permission to buy. It does not create rice. Nor does it necessarily give the household rice free of charge. Under this example, each household pays 2 × Rs 40 = Rs 80.
Now change the entitlement to three packets:
30 × 3 = 90 packets promised.
With stock still at 60, the shop is 30 packets short of meeting the promised entitlements. This 30-packet delivery gap is not the original 60-packet market shortage. One compares promises with stock; the other compares unrestricted quantity demanded with quantity supplied at Rs 40.
That distinction is useful in an answer about rationing: specify exactly which two quantities you are comparing.
Does rationing remove excess demand?
It can organise access and limit permitted purchases. It does not, by itself, change the original demand and supply schedules or satisfy everyone’s unrestricted wishes at Rs 40. A diagram of purchases after a quota must be interpreted differently from the original demand curve.
Possible allocation rules include equal household allowances, allowances based on household size, queues or a lottery. Each answers a different question about access. An equal allowance is easy to calculate, but equal packets per household need not mean equal packets per person.
Binding floor: read a surplus horizontally
Return to the original market and set a minimum price of Rs 60. This is a separate policy experiment, not a ceiling and floor imposed simultaneously.
Since 60 is above the equilibrium price of 50, the floor is binding.
At Rs 60:
- Quantity demanded = 200 - 2(60) = 80 packets.
- Quantity supplied = 4(60) - 100 = 140 packets.
- Surplus = Qs - Qd = 140 - 80 = 60 packets per day.
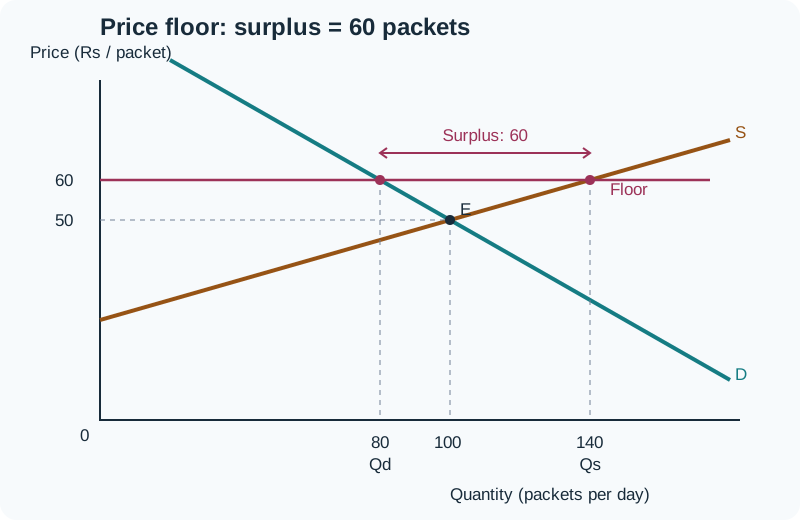
The drawing method stays the same, except the policy line now goes above E. Drop vertical guides from the two intersections to the quantity axis. Mark Qd = 80 on the left and Qs = 140 on the right.
The surplus measures what sellers wish to offer beyond private buyers’ purchases at the floor price. It is not automatically a warehouse inventory that has already been produced. If the question says output has been produced, then unsold stock is a suitable description.
A higher price does not guarantee higher total receipts
Assume no government purchases and all 80 packets demanded are sold. Sellers’ combined receipts are:
Rs 60 × 80 = Rs 4,800 per day.
At the original equilibrium, receipts were:
Rs 50 × 100 = Rs 5,000 per day.
In this example, the floor raises the price per packet but lowers total receipts by Rs 200. That is an outcome of these particular demand numbers, not a universal rule about every floor. Receipts also are not profit: costs would be needed to calculate profit.
What if the government buys the surplus?
Suppose the government explicitly commits to purchase every packet offered beyond private demand at Rs 60.
Government purchases = 140 - 80 = 60 packets.
Government purchase expenditure = 60 × Rs 60 = Rs 3,600 per day.
Private expenditure = 80 × Rs 60 = Rs 4,800 per day.
Total receipts to sellers = Rs 3,600 + Rs 4,800 = Rs 8,400 per day, corresponding to 140 packets sold to both groups together.
Do not call all 140 packets household consumption. Households buy 80; the government buys 60. Storage and distribution costs, if any, are additional to the Rs 3,600 purchase expenditure.
OpenStax’s discussion of price ceilings and floors explains the distinction between supporting a price and purchasing excess supply. It also discusses possible effects such as reduced availability and quality under ceilings. A policy’s intended beneficiaries do not necessarily all benefit: access and implementation matter.
Why a non-binding control needs a different answer
Suppose our rice market instead receives a ceiling of Rs 60. The market can still trade at Rs 50, because 50 does not exceed the legal maximum. Equilibrium remains 100 packets at Rs 50 under the unchanged conditions.
Substituting Rs 60 into the equations gives Qd = 80 and Qs = 140, but this does not establish a surplus caused by that ceiling. Nobody has required the price to rise to 60. A maximum is permission to charge no more than an amount, not an instruction to charge exactly that amount.
Similarly, a floor of Rs 40 permits the Rs 50 equilibrium. Do not force the market down to 40 merely because the question mentions that number.
If demand or supply later changes, recompute equilibrium and repeat the check. A previously non-binding limit can become binding.
Keep movements and shifts separate
In our two policy experiments, we used the same D and S curves throughout. Changing the price at which quantities are read means moving along those curves. We did not assume new incomes, tastes, technology or production costs.
You may discuss later changes in production capacity, but identify them as an additional development. Do not shift supply left merely to make a ceiling diagram show a shortage. The two intersections at the controlled price already show it.
For more practice keeping these ideas separate, see our explanation of the price mechanism in different economic systems.
A reliable written-answer format
For a graph question, link the calculation to the diagram rather than leaving the reader to connect them. Using our ceiling example:
“Equilibrium occurs at E, where Qd = Qs = 100 packets and price is Rs 50. The ceiling of Rs 40 is below equilibrium and is therefore binding. At this price, Qd is 120 packets and Qs is 60 packets. Excess demand is 120 - 60 = 60 packets per day, shown by the horizontal gap between the supply and demand intersections. With no additional supply and all available packets sold, trade is limited to 60 packets. Rationing can allocate this available stock.”
Adapt the final sentence to the question. If it asks only for a numerical shortage, a long policy discussion is unnecessary. If it asks for consequences, include access, allocation and the assumptions behind the result.
Practice: six checks before you move on
Use a new imaginary market:
Qd = 180 - 3P; Qs = 2P - 20.
P is rupees per unit, and quantities are units per week. Restrict attention to prices where both quantities are non-negative.
- Find equilibrium price and quantity.
- A ceiling is set at Rs 30. Find quantity demanded, quantity supplied, shortage and the standard quantity traded.
- A floor is set at Rs 50. Find the surplus and private buyers’ expenditure.
- If the government buys the entire surplus at that floor, calculate its purchase expenditure.
- What happens under a ceiling of Rs 45, with no other change?
- At the Rs 30 ceiling, 20 households each receive an entitlement of three units. Can the available supply meet all entitlements?
Answers with working
1. Equilibrium: 180 - 3P = 2P - 20, so 200 = 5P and P = Rs 40. Quantity = 180 - 120 = 60 units. Check: 80 - 20 = 60.
2. Ceiling at Rs 30: It is binding because 30 < 40. Qd = 90; Qs = 40. Shortage = 50 units per week. Standard trade = 40 units, assuming all supplied units reach buyers. The fall from equilibrium trade is 60 - 40 = 20 units, not 50.
3. Floor at Rs 50: It is binding because 50 > 40. Qd = 30; Qs = 80. Surplus = 50 units per week. Private expenditure = 30 × Rs 50 = Rs 1,500 per week.
4. Government purchases: 50 units × Rs 50 = Rs 2,500 per week. Combined seller receipts are Rs 1,500 + Rs 2,500 = Rs 4,000 if all 80 units are bought.
5. Ceiling at Rs 45: It is non-binding. Price remains Rs 40 and quantity remains 60 units. Do not substitute 45 as if it were a compulsory selling price.
6. Entitlements: 20 × 3 = 60 units promised, but only 40 are supplied. The entitlement shortfall is 20 units. Two units per household would fit the available stock, assuming all 20 participate.
Frequently asked questions
Why is an effective price ceiling below equilibrium?
It must block the price that would otherwise clear the market. In our rice example, a Rs 40 maximum blocks Rs 50; a Rs 60 maximum allows it. The first changes the outcome, while the second leaves equilibrium feasible.
Why is an effective price floor above equilibrium?
A minimum above equilibrium prevents the price from falling to the market-clearing level. In our example, a Rs 60 minimum rules out Rs 50, whereas a Rs 40 minimum does not.
What is the formula for a shortage?
At the relevant price, shortage = quantity demanded minus quantity supplied, provided quantity demanded is larger. Use quantities measured over the same period and in the same units.
What is the formula for a surplus?
Surplus = quantity supplied minus quantity demanded, provided quantity supplied is larger. For the rice floor example, that is 140 - 80 = 60 packets per day.
Is quantity demanded the same as quantity sold?
No. At our Rs 40 ceiling, buyers want 120 packets, but supply limits standard sales to 60. Quantity demanded describes purchases buyers wish to make at that price, not completed transactions.
Does rationing increase supply?
An allocation rule alone does not add stock. In our example, dividing 60 packets among 30 households changes access to those packets. Additional procurement or production would be a separate action.
Does every price floor involve government buying?
No. Treat government purchases as an explicit condition. Without them, our floor example has private sales of 80 packets; with full surplus purchases, sellers can sell 140 packets to private buyers and the government together.
Does a shortage mean scarcity?
Scarcity is the broader problem of limited resources relative to wants. A shortage is a particular market gap at a stated price. A market can clear and still involve scarce resources and choices about their use.
Should I shift demand or supply when drawing a price control?
Not for the initial control alone in these examples. Keep the curves and read their intersections with the horizontal policy line. Shift a curve only when the question provides a separate reason, such as a change in production costs.
What should I check last in my graph?
Check the policy line’s position relative to equilibrium, identify which intersection is Qd and which is Qs, and label the horizontal gap with quantity units. Then check that your written answer distinguishes planned quantities, the gap and actual trade.
Looking for commerce tuitions?
Prachi is a gold-medalist commerce teacher with experience at Deloitte and KPMG. She focuses on fundamentals to build a strong foundation.