
 Whatsapp
Movement Along a Demand Curve vs Shift: The Cause Test
Tell demand movements from shifts with labelled diagrams, worked schedules, related-goods examples, and a simple cause test for tricky questions.
- 11th
- 12th
- Economics

A stationery shop sells more notebooks this week. Has demand increased?
Perhaps the shop reduced the price. Perhaps students received higher allowances. Perhaps a new school opened nearby. The result sounds similar, but the diagram depends on the reason.
A change in a product’s own price, with other demand factors unchanged, causes movement along its demand curve. A change in another demand factor changes the curve itself. This distinction is explained in NCERT’s Theory of Consumer Behaviour, section 2.4.6.
The useful habit is to finish this sentence before drawing: “The quantity changed because…” We will use that habit to solve schedules, draw the right arrows, and handle questions that mention two products or two changes at once.
All numerical schedules and practice situations below are original teaching examples. Unless a question states otherwise, the diagrams use an ordinary downward-sloping demand curve.
Demand and quantity demanded: the whole menu and one choice
Demand describes the quantities buyers are willing and able to purchase at different prices over a stated period. Quantity demanded is the amount at one particular price. On a graph, demand is the curve; quantity demanded belongs to a point on it. OpenStax distinguishes these two terms in its introduction to demand.
Imagine asking the stationery shop’s customers five separate questions: “How many notebooks would you buy in a week if each cost Rs. 20? What about Rs. 30? Rs. 40?”
The answers make a schedule. They are alternative purchasing plans, not five purchases to add together.
| Price per notebook | Notebooks demanded per week |
|---|---|
| Rs. 20 | 100 |
| Rs. 30 | 80 |
| Rs. 40 | 60 |
| Rs. 50 | 40 |
| Rs. 60 | 20 |
At Rs. 40, the quantity demanded is 60 notebooks. The entire table describes demand under the assumed conditions.
If the price falls to Rs. 30, the table already tells us the new quantity: 80. We have selected a different row of the same schedule. We do not need a new schedule simply because the shop now charges a different price.
The cause test: three questions before the diagram
1. Which product’s demand are you explaining?
Write its name beside your answer. If the question asks about tea, your axes must show the price of tea and the quantity of tea.
This small step prevents a large mistake: treating the price of coffee as though it were tea’s own price.
2. Did only that product’s current price change?
If yes, keep the original demand curve. If income, preferences, a related product’s price, or another demand condition changed, investigate a shift. If several things changed, separate their effects.
3. At the same price, would buyers now choose a different quantity?
Compare the old and new purchasing plans at a common price. A higher quantity indicates a rightward shift over that range; a lower quantity indicates a leftward shift. This is a comparison method. It does not mean that the eventual market price must stay unchanged.
For a basic examination question, connect all three steps:
Product -> cause -> quantity at a common price -> diagram and term.
Movement along the demand curve: extension and contraction
Use the notebook schedule above. Keep allowances, preferences, the number of customers, and related prices unchanged.
Price falls: extension of demand
The price falls from Rs. 50 to Rs. 30. Weekly quantity demanded rises from 40 to 80 notebooks.
Draw point A at quantity 40 and price 50. Draw point B at quantity 80 and price 30. Both points belong to the original curve, D0. An arrow from A to B runs downwards and to the right.
This is an extension of demand, also called expansion of demand or an increase in quantity demanded.
A complete answer would be:
“The fall in the notebook’s own price from Rs. 50 to Rs. 30 raises its quantity demanded from 40 to 80 per week, other demand factors remaining unchanged. This is an extension of demand, shown by movement from A to B along D0.”
Price rises: contraction of demand
Reverse the same example. Price rises from Rs. 30 to Rs. 50 and weekly quantity demanded falls from 80 to 40.
Now the arrow goes from B to A, upwards and to the left, along D0. This is a contraction of demand, or a decrease in quantity demanded.
You still draw only one curve.
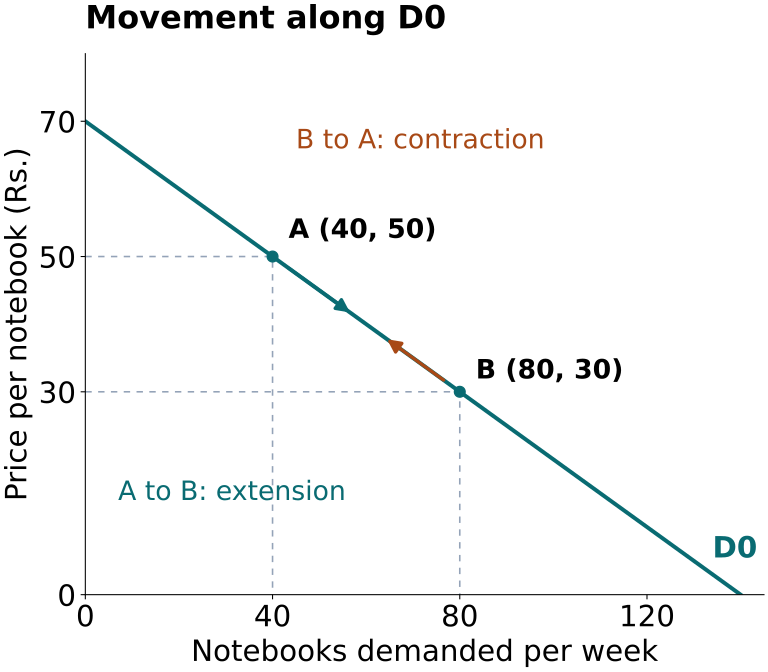
Notice that point B lies farther right than point A. That does not make this a rightward shift. The position of a point and the position of an entire curve are different things.
Shift of the demand curve: increase and decrease
Now suppose a new school opens nearby and adds notebook buyers. At each listed price, the shop’s customers would collectively buy 30 more notebooks per week.
The original schedule cannot represent this new situation. At Rs. 40 it predicts 60 notebooks, while the new purchasing plan calls for 90.
| Price per notebook | Original D0 | New D1 |
|---|---|---|
| Rs. 20 | 100 | 130 |
| Rs. 30 | 80 | 110 |
| Rs. 40 | 60 | 90 |
| Rs. 50 | 40 | 70 |
| Rs. 60 | 20 | 50 |
Quantities are notebooks per week. Compare across a row to see the shift: the same price is associated with a larger quantity.
Draw D1 to the right of D0. At Rs. 40, mark A on D0 at 60 notebooks and C on D1 at 90. The arrow from A to C crosses between curves at the same height. This is an increase in demand.
For a decrease, imagine a separate situation in which customers want 30 fewer notebooks at each price in the relevant range. At Rs. 40, quantity falls from 60 to 30. Draw the new curve, D2, to the left of D0.
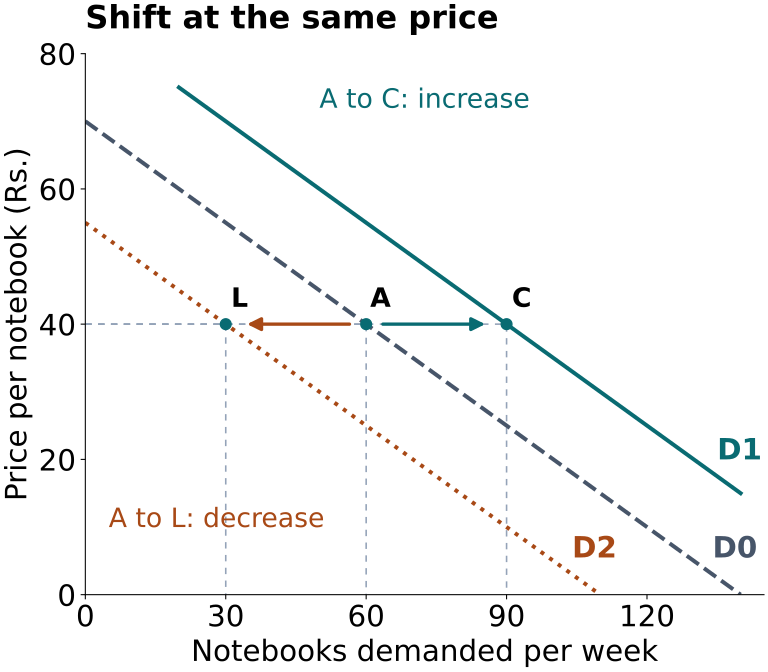
The extra 30 notebooks make these particular curves parallel. Real demand changes need not add the same quantity at every price. Parallel lines are a convenient teaching example, not part of the definition.
Movement versus shift: the four cases together
| Case | Cause | Diagram |
|---|---|---|
| Extension | Own price falls | Down and right along one curve |
| Contraction | Own price rises | Up and left along one curve |
| Increase in demand | Another factor raises demand | Curve shifts right |
| Decrease in demand | Another factor lowers demand | Curve shifts left |
In the movement cases, other demand factors stay unchanged. In the shift cases, compare quantities at the same price to establish the direction.
Here is a useful self-check: if you have written “extension” but drawn two demand curves, your words and diagram disagree. If you have written “increase in demand” but shown only an own-price fall, revisit the cause.
Which factors shift demand, and in which direction?
Income, preferences, related prices, expectations, and the number or composition of buyers can change demand. The direction depends on the relationship involved. OpenStax’s section on demand shifts explains these determinants.
Income: check whether the good is normal or inferior
For a normal good, higher income increases demand. For an inferior good, higher income reduces demand. “Inferior” describes the income relationship; it does not mean that a product is defective. The classification can vary by buyer and income range.
Try these two invented cases, holding prices fixed:
- Normal-good case: A family receives a pay rise and increases its planned monthly purchases of fresh fruit from 12 kg to 15 kg. The fruit demand curve shifts right.
- Inferior-good case: A student receives a larger allowance and reduces purchases of a particular basic meal from eight to five per month, choosing other meals instead. For this student over this income range, that basic meal behaves as an inferior good, and its demand curve shifts left.
Do not assume that every inexpensive item is inferior. Use the question’s description of how purchases respond to income. The distinction is covered in NCERT section 2.4.3.
Substitutes: keep the two prices separate
Suppose two notebook brands, A and B, are substitutes for the customers in a question.
Brand B raises its price. Brand A’s price stays at Rs. 40. Some buyers switch to A, increasing its weekly quantity demanded from 60 to 75 at that price.
For Brand A, this is a rightward demand shift: the cause is a change in another product’s price.
For Brand B, its own price increase causes contraction along its demand curve, assuming its other demand factors are unchanged.
One event can therefore produce different classifications in two markets. Your answer depends on the product named in the question.
Complements: think about the cost of using them together
Suppose a printer and its compatible ink cartridges are complements. Cartridge prices rise while the printer’s price is unchanged. Some buyers decide that owning the printer will be too expensive to run.
If planned printer purchases fall at each printer price, printer demand shifts left. The cartridge price does not belong on the printer diagram’s vertical axis.
In the usual related-goods relationships, a dearer substitute raises demand for the product being studied, while a dearer complement lowers it. NCERT section 2.4.4 explains substitutes and complements.
Preferences, expectations, and buyer numbers
Treat each of these as a separate practice situation:
| Situation | Demand effect, with own price unchanged |
|---|---|
| A reading club makes a particular magazine more appealing | Rightward shift for the magazine |
| Customers lose interest in a once-popular design | Leftward shift for that design |
| Buyers bring forward purchases of a storable item because they expect it to cost more next month | Rightward shift in current demand |
| Families leave a neighbourhood and there are fewer customers for a local shop | Leftward shift in that shop’s market demand |
An expected future price and the current price are different variables. Also distinguish market demand from one person’s demand: more customers can raise the market total even when each existing customer’s purchasing plan stays the same.
A schedule trick: read down for price, across for conditions
Return to the notebook schedule with columns D0 and D1.
- Within D0: Going from Rs. 50 and 40 notebooks to Rs. 30 and 80 notebooks illustrates movement along D0.
- Across at Rs. 40: Going from 60 on D0 to 90 on D1 illustrates the demand shift.
- Across and down together: Comparing 60 on D0 at Rs. 40 with 110 on D1 at Rs. 30 combines a shift and a price change.
The third comparison cannot be described fully by “extension” alone. Both the purchasing conditions and the price differ.
This is why the row and column headings deserve as much attention as the numbers. A table is already a diagram in another form.
What if own price and income both change?
Consider this original model, where P is the price per notebook in rupees and Q is notebooks demanded per week:
Original demand: Q0 = 140 - 2P
At a price of Rs. 40:
Q0 = 140 - 2(40) = 60 notebooks.
Now suppose higher incomes increase notebook demand, with notebooks treated as a normal good. The new schedule is:
New demand: Q1 = 170 - 2P
At the old price of Rs. 40:
Q1 = 170 - 2(40) = 90 notebooks.
That is a rightward shift of 30 notebooks at the common price. But suppose the actual new price is Rs. 55:
Q1 = 170 - 2(55) = 60 notebooks.
The final quantity equals the original quantity. Yet demand has increased.
The two effects offset one another in this example: the new demand conditions add 30 notebooks at the original price, while the Rs. 15 price rise reduces quantity by 30 along the new curve.
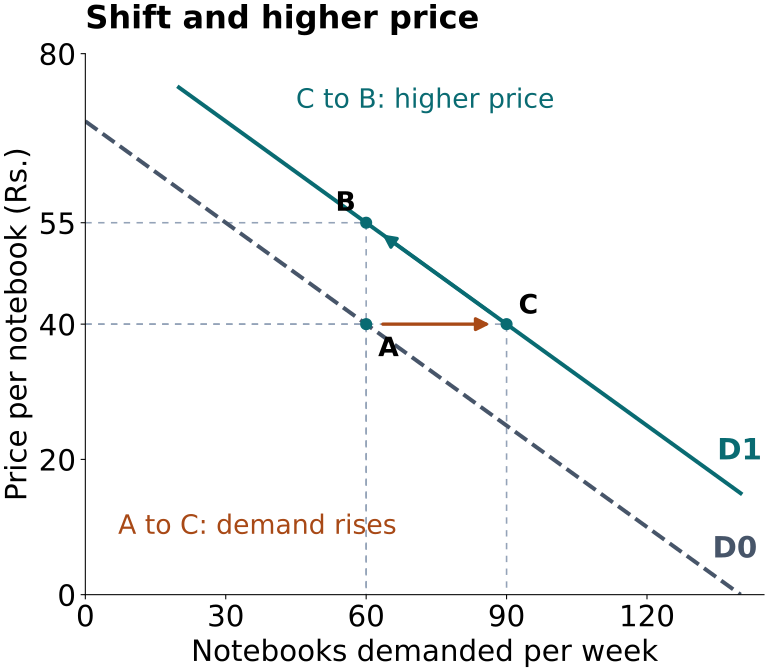
Try changing the final price yourself:
| Final price on D1 | Final quantity | Change from the original 60 |
|---|---|---|
| Rs. 45 | 80 | 20 more |
| Rs. 55 | 60 | No change |
| Rs. 65 | 40 | 20 fewer |
The rightward demand shift is present in all three rows. The final quantity depends on how large the price change is.
Three traps that deserve an extra minute
A price fall improves purchasing power. Does that shift demand?
Suppose your weekly allowance remains Rs. 200, but a notebook becomes cheaper. Your money now buys more notebooks. That purchasing-power effect is part of the response to the notebook’s own-price change; it is already captured by movement along its demand curve.
An independent rise in the allowance is a different change and can shift demand. NCERT discusses the income and substitution effects of an own-price change in section 2.4.2 of the chapter linked above.
A supply problem raises price. Should demand shift left too?
Imagine a machine breakdown reduces the supply of notebooks. With demand conditions unchanged, the resulting higher market price causes a contraction along the existing demand curve. Do not add a demand shift merely because customers buy fewer notebooks at the higher price.
The demand curve shifts only if a demand determinant also changes. OpenStax addresses this mistake in its explanation of shifts and movements during equilibrium adjustment.
Two observations are given, but the cause is missing
“Price rose from Rs. 30 to Rs. 40 and sales fell from 80 to 60.”
These figures fit our original demand schedule. But without information about the other conditions, observed price and sales alone do not prove that demand stayed unchanged. Sales may also be affected by availability.
For a textbook question that explicitly holds other demand factors constant, classify the own-price response as contraction. For an incomplete real-world statement, identify the missing information instead of inventing a cause.
How to draw an answer that matches your explanation
Use this short sequence for a demand-only question:
- Put the product’s price on the vertical axis and quantity demanded on the horizontal axis. Include units and the period when supplied.
- Draw and label the original curve D0.
- For movement, mark two price-quantity points on D0 and draw the arrow along it.
- For a shift, add D1 or D2, then compare points at a common price using a horizontal guide.
- Explain the cause, direction, and correct term in a sentence using your point labels.
Keep supply curves for questions that actually ask you to determine market equilibrium. For a simple distinction, the extra curve makes your explanation harder to follow.
If you would like to revisit willingness, ability to pay, and the law of demand first, use our introduction to demand.
Practice: classify the cause before checking the answer
1. A discount on the product itself
A shop reduces the price of an eraser from Rs. 10 to Rs. 8. Buyers choose more erasers, with all other demand conditions unchanged.
Answer: Extension of demand for erasers. Draw one curve and an arrow downwards and to the right. The cause is the eraser’s own-price fall.
2. A price change in another market
Two brands of juice are substitutes. Brand Y becomes cheaper; Brand X’s price stays unchanged. What happens to demand for X?
Answer: It decreases, other things equal. Draw X’s demand curve shifting left as some buyers switch to the cheaper substitute. This is not contraction for X because X’s own price has not risen.
3. More income, fewer purchases
A consumer’s income rises and, at the unchanged price, purchases of a particular budget meal fall from six to four per month.
Answer: The meal behaves as an inferior good over this income range. Its demand decreases. For the usual textbook case, show a leftward shift.
4. A cheaper complement
A printer and its ink cartridges are complements. Ink becomes cheaper while the printer’s price and other demand conditions stay fixed.
Answer: Printer demand increases. Draw a rightward shift. Cheaper ink makes using the printer more attractive at the same printer price.
5. Read the equation
Demand is Q = 180 - 3P. Price falls from Rs. 40 to Rs. 30 with the equation unchanged.
Answer: Quantity rises from 60 to 90 units. This is extension along the same curve: 180 - 3(40) = 60, and 180 - 3(30) = 90.
6. Read the new equation
At a fixed price of Rs. 40, demand changes from Q0 = 180 - 3P to Q1 = 210 - 3P after a favourable change in preferences.
Answer: Quantity at that price rises from 60 to 90. This is increased demand, shown by a rightward shift. The numerical increase matches Question 5, but the cause and diagram differ.
7. A future price rise
Buyers expect a storable product to become more expensive next week and bring purchases forward. Its current price has not changed.
Answer: Current demand increases. Draw a rightward shift. The changing determinant is expectations, not the current own price.
8. Find the missing fact
A shop reports that weekly notebook sales increased from 60 to 90. Decide whether the demand curve shifted.
Answer: There is not enough information. Ask whether notebook prices, demand conditions, or availability changed. The quantities alone cannot select the diagram.
Sources and further reading
- NCERT, Introductory Microeconomics, Theory of Consumer Behaviour, reprint 2026-27, sections 2.4.2 to 2.4.6.
- OpenStax, Principles of Economics 3e, Demand, Supply, and Equilibrium in Markets for Goods and Services.
- OpenStax, Principles of Microeconomics 3e, Shifts in Demand and Supply for Goods and Services.
- OpenStax, Principles of Economics 3e, Changes in Equilibrium Price and Quantity: The Four-Step Process.
Frequently asked questions
What is the main difference between movement and shift of a demand curve?
Movement changes the point on an existing curve because the product’s own price changes, with other demand conditions fixed. A shift changes the purchasing relationship because another demand factor changes.
Are extension and expansion of demand the same?
Yes. Both describe increased quantity demanded following an own-price fall, other things equal. The diagram shows movement down a downward-sloping demand curve.
How is contraction different from a decrease in demand?
Contraction follows an own-price rise and stays on one curve. A decrease in demand follows a change in another demand factor and shifts the curve left.
Can a higher quantity occur without a rightward shift?
Yes. In our notebook schedule, a price fall from Rs. 50 to Rs. 30 raises quantity from 40 to 80 on D0. The curve itself stays unchanged.
Why do we hold price constant when showing a shift?
A common price lets us isolate the difference between the old and new purchasing plans. It is a way to compare curves, not a promise that the final market price will remain fixed.
Does a price change in a substitute cause movement or shift?
It shifts demand for the product being studied. A change in Brand B’s price is a related-price change for Brand A, even though it is an own-price change for B.
Does higher income always increase demand?
No. The direction depends on the good’s income relationship. Higher income increases demand for a normal good and decreases demand for an inferior good over the relevant income range.
Must shifted demand curves be parallel?
No. Our diagrams use equal horizontal gaps to keep the arithmetic easy. A change in conditions can affect quantities differently at different prices.
Can demand increase while the final quantity stays the same?
Yes. In our combined example, demand shifts right, but price rises from Rs. 40 to Rs. 55. Final quantity is 60 notebooks on the new curve, equal to the original quantity.
Does a supply change automatically shift demand?
No. If demand determinants are unchanged, the resulting price adjustment moves buyers along the existing demand curve. A demand shift needs its own cause.
Is every inferior good a Giffen good?
No. Inferior describes the response to income; Giffen describes an unusual own-price response. Do not draw an upward-sloping curve simply because a question calls a good inferior.
What should I check just before submitting the diagram?
Check the product on both axes, the cause, the number of curves, the arrow direction, and the term in your explanation. Each should tell the same story.
Looking for commerce tuitions?
Prachi is a gold-medalist commerce teacher with experience at Deloitte and KPMG. She focuses on fundamentals to build a strong foundation.