
 Whatsapp
Less Than and More Than Ogives: Find the Median Graphically
Learn how less than and more than ogives work, how to prepare cumulative frequency tables, and how to locate the median from a graph.
- 11th
- Economics
Ogives become simple when you stop seeing them as just another graph and start seeing them as a story of accumulation.
A normal frequency table tells you how many observations are present in each class interval. An ogive goes one step further. It shows how the total keeps building as you move across the class intervals. That is why an ogive is also called a cumulative frequency curve.
The word “cumulative” is the key. It means “added step by step.”
If 6 students are in the first class, 10 students are in the second class, and 14 students are in the third class, the cumulative total after three classes is not 14. It is 6 + 10 + 14 = 30.
That running total is what an ogive shows.
In this guide, we will build the idea slowly: first the meaning, then the tables, then the graph, then the median.
What an Ogive Really Shows
An ogive is a graph of cumulative frequency.
In a grouped frequency distribution, the data is arranged in class intervals such as 0-10, 10-20, 20-30, and so on. Each class has a frequency. That frequency tells you how many observations fall inside that interval.
An ogive does not focus on one interval at a time. It focuses on the accumulated total up to a point or from a point.
For example, suppose a marks distribution says:
| Marks | Number of students |
|---|---|
| 0-10 | 4 |
| 10-20 | 8 |
| 20-30 | 14 |
The frequency 14 tells you how many students scored between 20 and 30.
But the cumulative frequency up to 30 tells you how many students scored below 30:
4 + 8 + 14 = 26So, cumulative frequency answers a different question.
| Question | What it uses |
|---|---|
| How many students are in the 20-30 class? | Frequency |
| How many students scored less than 30? | Cumulative frequency |
| How many students scored more than 30? | More than cumulative frequency |
This difference is the foundation of ogives.
Less Than Ogive and More Than Ogive
There are two common types of ogives:
- Less than ogive
- More than ogive
They use the same original data, but they accumulate the frequencies in opposite directions.
Less Than Ogive
A less than ogive shows how many observations are less than the upper limit of each class.
If the classes are 0-10, 10-20, 20-30, and 30-40, the less than cumulative frequencies are written as:
- less than 10
- less than 20
- less than 30
- less than 40
To prepare the less than cumulative frequency, you add frequencies from the top downward.
So the curve usually rises from left to right.
More Than Ogive
A more than ogive shows how many observations are more than the lower limit of each class.
If the classes are 0-10, 10-20, 20-30, and 30-40, the more than cumulative frequencies are written as:
- more than 0
- more than 10
- more than 20
- more than 30
- more than 40
To prepare the more than cumulative frequency, you can start with the total frequency and keep subtracting frequencies as you move downward.
So the curve usually falls from left to right.
The Main Difference in One Table
Here is the cleanest way to compare both types.
| Point of difference | Less than ogive | More than ogive |
|---|---|---|
| What it shows | Observations below a value | Observations above a value |
| Cumulative frequency is found by | Adding from the first class downward | Starting from total and subtracting step by step |
| X-values used | Upper class limits | Lower class limits |
| Shape | Generally rising | Generally falling |
| Use | Locate median, quartiles, percentiles | Locate median, compare with less than curve |
Both curves tell the same story from different sides.
The less than ogive asks, “How much has accumulated below this value?”
The more than ogive asks, “How much is still left above this value?”
The median sits at the point where the data is divided into two equal halves.
Why Ogives Help in Finding the Median
The median is the middle value of a distribution.
If there are 60 observations, the median position is:
N / 2 = 60 / 2 = 30This means the median is located around the point where 30 observations are below it and 30 observations are above it.
An ogive is perfect for this because it already shows accumulated frequencies.
In a less than ogive, you find the value corresponding to N / 2 on the cumulative frequency axis.
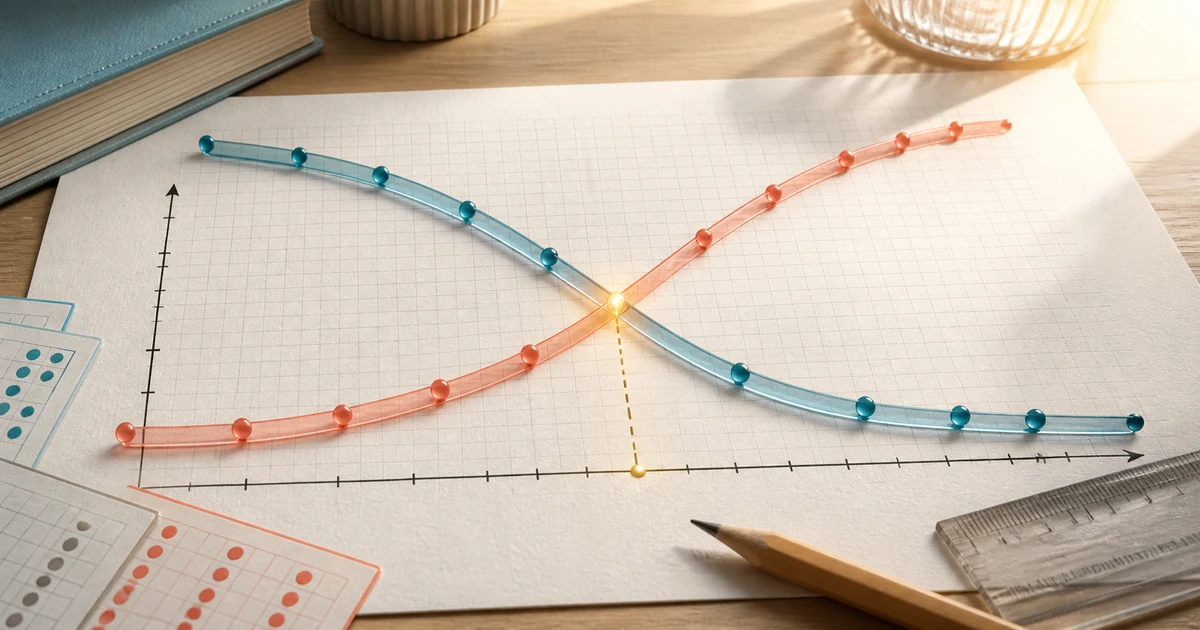
In a combined less than and more than ogive, you look at the point where both curves intersect. From that intersection, you drop a vertical line to the x-axis. The x-value gives the median.
This is why students should not confuse the median method with the mode-from-histogram method. The tallest frequency may help in finding mode, but median needs the middle position.
A Complete Worked Example
Let us use one clear example and carry it from table to graph to median.
The marks of 60 students are given below.
| Marks | Number of students |
|---|---|
| 0-10 | 4 |
| 10-20 | 8 |
| 20-30 | 14 |
| 30-40 | 18 |
| 40-50 | 10 |
| 50-60 | 6 |
| Total | 60 |
We will prepare both ogive tables.
Step 1: Prepare the Less Than Cumulative Frequency Table
For the less than table, add the frequencies from the top.
| Marks less than | Frequency added | Less than cumulative frequency |
|---|---|---|
| 10 | 4 | 4 |
| 20 | 4 + 8 | 12 |
| 30 | 12 + 14 | 26 |
| 40 | 26 + 18 | 44 |
| 50 | 44 + 10 | 54 |
| 60 | 54 + 6 | 60 |
The points for the less than ogive are:
| X-value | Y-value |
|---|---|
| 0 | 0 |
| 10 | 4 |
| 20 | 12 |
| 30 | 26 |
| 40 | 44 |
| 50 | 54 |
| 60 | 60 |
We include the starting point (0, 0) because before the first class begins, no observation has accumulated.
Step 2: Prepare the More Than Cumulative Frequency Table
For the more than table, begin with the total frequency.
There are 60 students in all, so:
More than 0 = 60Now subtract class frequencies step by step.
| Marks more than | Calculation | More than cumulative frequency |
|---|---|---|
| 0 | Total | 60 |
| 10 | 60 - 4 | 56 |
| 20 | 56 - 8 | 48 |
| 30 | 48 - 14 | 34 |
| 40 | 34 - 18 | 16 |
| 50 | 16 - 10 | 6 |
| 60 | 6 - 6 | 0 |
The points for the more than ogive are:
| X-value | Y-value |
|---|---|
| 0 | 60 |
| 10 | 56 |
| 20 | 48 |
| 30 | 34 |
| 40 | 16 |
| 50 | 6 |
| 60 | 0 |
The more than ogive starts high and falls because fewer students remain above each higher mark.
Step 3: Choose a Suitable Scale
Before drawing the graph, choose a scale that uses the graph paper well.
For this example:
- x-axis can show marks from 0 to 60
- y-axis can show cumulative frequency from 0 to 60
You can use equal spacing for every 10 marks on the x-axis and every 10 students on the y-axis.
The exact scale can change depending on the question. What matters is that the graph should be neat, readable, and not squeezed into one corner.
Step 4: Draw the Less Than Ogive
To draw the less than ogive:
- Mark upper class limits on the x-axis.
- Mark less than cumulative frequencies on the y-axis.
- Plot the points from the less than table.
- Join the points with a smooth rising curve.
For our example, plot:
(0, 0), (10, 4), (20, 12), (30, 26), (40, 44), (50, 54), (60, 60)The curve should rise as you move from left to right.
Do not plot the original frequencies by mistake. The point for 30 is not 14. It is 26 because 26 students scored less than 30.
Step 5: Draw the More Than Ogive
To draw the more than ogive:
- Mark lower class limits on the x-axis.
- Mark more than cumulative frequencies on the y-axis.
- Plot the points from the more than table.
- Join the points with a smooth falling curve.
For our example, plot:
(0, 60), (10, 56), (20, 48), (30, 34), (40, 16), (50, 6), (60, 0)The curve should fall as you move from left to right.
If your more than ogive rises instead of falling, something has gone wrong in the cumulative frequency table.
Step 6: Locate the Median Using Only the Less Than Ogive
This is the most direct method.
Total frequency:
N = 60Median position:
N / 2 = 60 / 2 = 30Now use the graph:
- Find 30 on the y-axis.
- Draw a horizontal line from 30 to meet the less than ogive.
- From the point where it meets the curve, draw a vertical line down to the x-axis.
- Read the value on the x-axis.
That x-value is the graphical median.
In this example, the median will lie between 30 and 40 marks because the cumulative frequency before 30 marks is 26 and the cumulative frequency before 40 marks is 44. The 30th observation falls inside the 30-40 class.
Using the curve, the median will be close to 32 marks.
Step 7: Locate the Median Using Both Ogives
When both ogives are drawn on the same graph, the median can also be found from their point of intersection.
Use this method:
- Draw the less than ogive.
- Draw the more than ogive on the same graph.
- Find the point where the two curves cross.
- From the crossing point, draw a vertical line to the x-axis.
- The value on the x-axis is the median.
This works because the median divides the distribution into two equal parts. At that point, the accumulating observations below and the remaining observations above balance each other.
Because a graph is drawn by hand, a small difference in the final reading is normal. The answer may be written as an approximate value.
Verifying the Median by Formula
The graphical answer should be close to the formula answer.
The median formula for grouped data is:
Median = L + [(N / 2 - c.f.) / f] x hHere:
| Symbol | Meaning | Value in our example |
|---|---|---|
| L | Lower limit of median class | 30 |
| N | Total frequency | 60 |
| N / 2 | Median position | 30 |
| c.f. | Cumulative frequency before median class | 26 |
| f | Frequency of median class | 18 |
| h | Class width | 10 |
Substitute the values:
Median = 30 + [(30 - 26) / 18] x 10
Median = 30 + (4 / 18) x 10
Median = 30 + 2.22
Median = 32.22
So the median is approximately 32.22 marks.
Your graphical value may be around 32 marks, which is acceptable if the graph is drawn neatly.
What the Crossing Point Means
The crossing point of the two ogives is more than a drawing trick.
The less than curve is counting how many observations lie below each value. The more than curve is counting how many observations lie above each value.
Near the median, the data is divided into two halves. That is why the two curves meet around the middle position.
This also helps you remember which curve should move in which direction:
- less than curve rises because more values are included as the limit increases
- more than curve falls because fewer values remain above the limit as the limit increases
Think of the two curves as two students walking toward the same classroom from opposite ends of a corridor. One is counting how many students have already entered. The other is counting how many are still outside. The median is where their counts balance.
Where Students Usually Make Mistakes
Ogives are not difficult, but they punish small errors. Most mistakes happen before the graph is even drawn.
Mistake 1: Plotting Frequency Instead of Cumulative Frequency
This is the most common error.
For the interval 20-30, the frequency may be 14. But the less than cumulative frequency at 30 may be 26. If you plot 14 instead of 26, you are drawing a different graph.
Mistake 2: Using Midpoints for an Ogive
Midpoints are used in some other graphs, but an ogive uses class limits.
For a less than ogive, use upper class limits.
For a more than ogive, use lower class limits.
If you use midpoints, the graph may look neat, but it will not represent the ogive correctly.
Mistake 3: Forgetting the Starting or Ending Point
For a less than ogive, it is useful to start at the lower limit of the first class with cumulative frequency 0.
For a more than ogive, it is useful to end at the upper limit of the last class with cumulative frequency 0.
These points help the curve sit properly on the graph.
Mistake 4: Reading the Median From the x-Axis First
For the less than ogive method, do not start by guessing on the x-axis.
Start from N / 2 on the y-axis, move horizontally to the curve, then come down vertically to the x-axis.
The order matters.
Mistake 5: Drawing the Curves Too Roughly
An ogive is a graph-reading tool. If the scale is careless, the curve is uneven, or the points are plotted incorrectly, the median reading will also become weak.
Use a pencil, mark the points clearly, and join them carefully.
How to Decide Which Method to Use
If the question asks for a less than ogive, prepare only the less than cumulative frequency table and draw the less than curve.
If the question asks for a more than ogive, prepare the more than cumulative frequency table and draw the more than curve.
If the question asks you to locate the median graphically using ogives, drawing both curves on the same graph is often the clearest method.
If only one ogive is required, use N / 2 on the cumulative frequency axis.
| Question wording | Best approach |
|---|---|
| Draw a less than ogive | Prepare less than cumulative frequency and plot upper limits |
| Draw a more than ogive | Prepare more than cumulative frequency and plot lower limits |
| Find median from less than ogive | Use N / 2 on y-axis, then read x-axis |
| Find median from both ogives | Read the x-value at the intersection |
| Verify median | Use the grouped median formula |
A Quick Checklist Before You Finish
Use this checklist before submitting an ogive answer.
| Check | What to confirm |
|---|---|
| Total frequency | Does the final less than cumulative frequency equal N? |
| More than table | Does the first more than cumulative frequency equal N? |
| Limits | Did you use upper limits for less than and lower limits for more than? |
| Scale | Is the graph scale clear and consistent? |
| Median position | Did you use N / 2 correctly? |
| Reading | Did you drop the vertical line carefully to the x-axis? |
| Final answer | Did you write that the graphical answer is approximate? |
How to Practise Ogives Without Fear
The best way to practise ogives is not to draw ten graphs blindly. It is better to do fewer questions carefully and understand the movement of the cumulative totals.
Try this practice rhythm:
- First, prepare only the less than cumulative frequency table.
- Then prepare only the more than cumulative frequency table.
- Check that both are based on the same total N.
- Plot both curves on rough graph paper.
- Find the median graphically.
- Verify it with the formula.
- Circle the exact place where you made a mistake, if any.
If you follow this pattern for three to five questions, the topic becomes much less confusing.
Frequently Asked Questions
What is an ogive?
An ogive is a cumulative frequency curve. It shows how frequencies accumulate across class intervals.
What is the difference between a less than ogive and a more than ogive?
A less than ogive shows how many observations are below each upper class limit. A more than ogive shows how many observations are above each lower class limit.
Which class limits are used for a less than ogive?
A less than ogive uses upper class limits on the x-axis.
Which class limits are used for a more than ogive?
A more than ogive uses lower class limits on the x-axis.
How do you find the median using a less than ogive?
Find N / 2 on the y-axis, draw a horizontal line to the less than ogive, then draw a vertical line down to the x-axis. The x-value gives the median.
How do you find the median using both ogives?
Draw the less than and more than ogives on the same graph. The x-value below their point of intersection gives the median.
Why does the less than ogive rise?
It rises because more observations are included as the upper limit increases.
Why does the more than ogive fall?
It falls because fewer observations remain above each higher lower limit.
Is the median found from an ogive exact?
It is usually an approximate graphical value. A neatly drawn graph gives a value close to the grouped median formula.
What is the biggest mistake in ogive questions?
The biggest mistake is plotting original frequencies instead of cumulative frequencies. Always prepare the cumulative frequency table before drawing the graph.
Looking for commerce tuitions?
Prachi is a gold-medalist commerce teacher with experience at Deloitte and KPMG. She focuses on fundamentals to build a strong foundation.