
 Whatsapp
AFC, AVC, AC, MC, TFC, TVC and TC: Cost Curves Explained
Connect all seven cost measures with formulas, worked schedules, cost-curve diagrams, missing-value examples and practice questions with answers.
- 11th
- 12th
- Economics

Seven abbreviations can make production costs feel like seven separate chapters. They are really seven ways of asking about the same business.
Imagine a pottery studio. It pays for its workshop, buys clay and glaze, and makes bowls. You might ask what the whole batch costs, what each bowl costs on average, or what adding one more bowl costs. Change the question, and you change the cost measure.
Let’s connect the formulas first, then use one original schedule to explain the graphs. By the end, you should be able to rebuild a missing column instead of trying to remember every number separately.
The seven cost measures in one map
Here, Q means quantity of output. Total costs are measured in rupees for a given production period. Average and marginal costs are measured in rupees per unit.
| Measure | Meaning | Calculation |
|---|---|---|
| TFC | Total fixed cost | TC - TVC |
| TVC | Total variable cost | TC - TFC |
| TC | Total cost | TFC + TVC |
| AFC | Average fixed cost | TFC / Q |
| AVC | Average variable cost | TVC / Q |
| AC | Average total cost | TC / Q |
| MC | Marginal cost | Change in TC / change in Q |
AC is also called ATC. In short-run discussions, SAC means short-run average cost and SMC means short-run marginal cost.
The definitions and notation follow the standard framework in NCERT’s Production and Costs chapter. The examples below use our own pottery-studio figures.
First decide what stays fixed
We are studying the short run, when at least one input cannot be varied. For our studio, suppose the workshop is already rented and its size cannot change during the production period.
Its fixed workshop charge is Rs. 120. That charge is the same whether it makes no bowls or eight bowls. Clay and glaze costs depend on production.
Real electricity bills can have both a standing charge and a usage charge. Similarly, wages may be fixed or variable depending on the employment arrangement. Read the question’s assumptions rather than classifying an expense by its name alone.
For this exercise, assume variable expenditure is zero at zero output, input prices are unchanged, and TFC remains Rs. 120 throughout.
Build the total-cost schedule
All money figures in this table are in rupees.
| Q | TFC | TVC | TC |
|---|---|---|---|
| 0 | 120 | 0 | 120 |
| 1 | 120 | 60 | 180 |
| 2 | 120 | 100 | 220 |
| 3 | 120 | 132 | 252 |
| 4 | 120 | 160 | 280 |
| 5 | 120 | 200 | 320 |
| 6 | 120 | 252 | 372 |
| 7 | 120 | 322 | 442 |
| 8 | 120 | 416 | 536 |
At four bowls, TC = 120 + 160 = Rs. 280. At seven bowls, TC = 120 + 322 = Rs. 442.
Notice that the difference between TC and TVC stays Rs. 120 in every row. That is our first built-in checking device. If you get a different gap without any change in fixed cost, revisit your arithmetic.
At zero output, TC is Rs. 120, not zero. The workshop charge still exists even when the studio makes nothing.
Find MC by comparing neighbouring rows
The second bowl raises TC from Rs. 180 to Rs. 220. Its MC is Rs. 40.
The third bowl raises TC from Rs. 220 to Rs. 252. Its MC is Rs. 32.
For the first bowl, remember to subtract the zero-output cost:
MC of the first bowl = 180 - 120 = Rs. 60.
Writing Rs. 180 would wrongly include the workshop charge in the extra cost of that bowl.
You can obtain the same answer from TVC: 60 - 0 = Rs. 60. The fixed charge cancels when two total-cost figures are subtracted.
Turn the totals into average and marginal costs
The following figures are rupees per bowl. Recurring decimals are rounded to two places.
| Q | AFC | AVC | AC | MC |
|---|---|---|---|---|
| 1 | 120.00 | 60.00 | 180.00 | 60 |
| 2 | 60.00 | 50.00 | 110.00 | 40 |
| 3 | 40.00 | 44.00 | 84.00 | 32 |
| 4 | 30.00 | 40.00 | 70.00 | 28 |
| 5 | 24.00 | 40.00 | 64.00 | 40 |
| 6 | 20.00 | 42.00 | 62.00 | 52 |
| 7 | 17.14 | 46.00 | 63.14 | 70 |
| 8 | 15.00 | 52.00 | 67.00 | 94 |
Let’s audit the row for six bowls together:
- AFC = 120 / 6 = Rs. 20.
- AVC = 252 / 6 = Rs. 42.
- AC = 372 / 6 = Rs. 62.
- MC = (372 - 320) / (6 - 5) = Rs. 52.
The average cost is Rs. 62 across all six bowls. The sixth bowl adds Rs. 52 to the bill. These answer different questions, which is why dividing 372 by 6 cannot give MC.
Do not calculate AFC, AVC or AC at Q = 0 by writing zero. Division by zero is undefined. In this discrete schedule, MC at zero output is also left blank because there is no preceding production interval to compare.
Read the total-cost graph
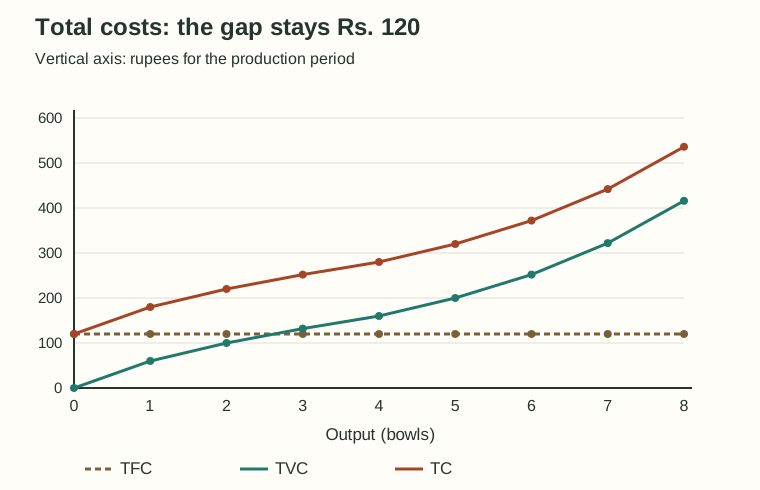
Draw TFC as a horizontal line at Rs. 120. Plot TVC from the origin, then place TC Rs. 120 above TVC at each output.
From the third to the fourth bowl, TVC rises by only Rs. 28. From the seventh to the eighth, it rises by Rs. 94. The second segment is much steeper because the extra bowl is more expensive to produce.
The TC and TVC curves have the same slope at corresponding outputs. Their vertical gap is fixed, but their slopes need not be constant. Calling them straight parallel lines would misdescribe this schedule.
TVC never falls here, even while MC falls from Rs. 60 to Rs. 28. Each extra bowl still costs something; it just adds less than the previous bowl did.
Read AFC, AVC, AC and MC together
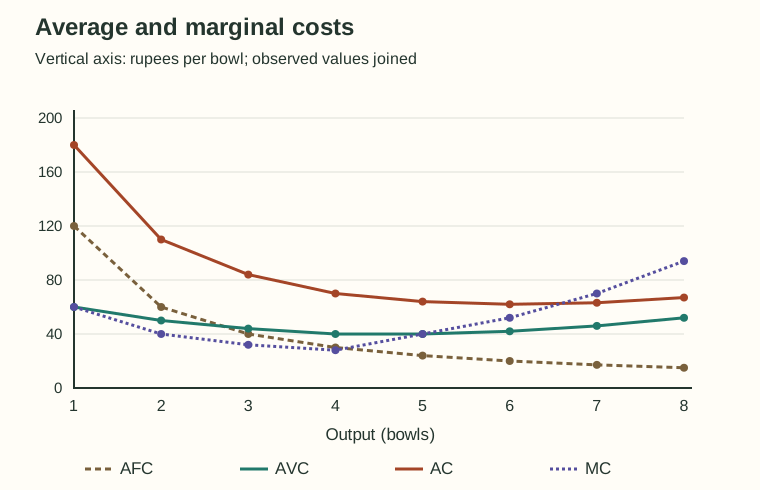
AFC keeps falling
Our Rs. 120 workshop charge is spread over more bowls: Rs. 60 each at two bowls, Rs. 30 each at four, and Rs. 15 each at eight.
On a smooth graph, AFC = 120 / Q is a rectangular hyperbola. For any finite positive Q it remains positive; it approaches the horizontal axis without touching it.
The AC-AVC gap gets smaller
At two bowls, AC - AVC = 110 - 50 = Rs. 60.
At eight bowls, AC - AVC = 67 - 52 = Rs. 15.
Those gaps are exactly the corresponding AFC values. This gives two quite different rules:
- TC - TVC = TFC: the total-cost gap stays constant.
- AC - AVC = AFC: the average-cost gap shrinks as output rises.
Do not transfer the shrinking-gap rule from the average graph to the total graph.
Rising MC can still pull AC down
Between four and six bowls, MC rises from Rs. 28 to Rs. 40 and then Rs. 52. Yet AC falls from Rs. 70 to Rs. 64 and then Rs. 62.
Why? The fifth bowl costs Rs. 40 to add, which is below the previous Rs. 70 average. The sixth costs Rs. 52 to add, which is below the previous Rs. 64 average. Each addition brings the overall average down.
Then the seventh bowl costs Rs. 70. That exceeds the previous average of Rs. 62, so the new AC rises to about Rs. 63.14.
The average-versus-extra-unit distinction is also illustrated in NIOS’s Cost and Revenue lesson.
Why smooth curves meet at their minima
For conventional smooth U-shaped curves, MC crosses AVC at AVC’s minimum and crosses AC at AC’s minimum, from below. Below an average, MC pulls it down; above it, MC pulls it up. The changeover occurs at equality. OpenStax explains this marginal-average relationship.
But do not force an exact equality into every discrete table. Here, the lowest observed AC is Rs. 62 at six bowls, while that row’s MC is Rs. 52. The next observed AC is higher. No missing or incorrect entry needs to be invented.
Our AVC stays at Rs. 40 for both four and five bowls because the fifth bowl’s MC is also Rs. 40. Discrete schedules can have ties.
In the usual smooth diagram with positive fixed cost, AVC reaches its minimum before AC. Our schedule helps explain why: between five and six bowls, AVC rises by Rs. 2, but AFC falls by Rs. 4. Their sum, AC, therefore falls by Rs. 2.
Why do the usual curves bend?
Think about the studio’s workbench. At first, organising tasks better can make each additional bowl easier to produce. Later, crowding around the same workbench makes extra output harder to obtain.
With unchanged input prices, increasing marginal productivity lowers MC; diminishing marginal productivity raises it. This is the short-run variable-proportions explanation, not an assumption that the workshop expands continuously.
For a simple model with labour as the only variable input and a constant wage w, MC = w / MP, where MP is labour’s marginal product. If a worker costs Rs. 240 and adds 12 bowls, the extra labour cost per bowl is Rs. 20. If the next worker adds only eight bowls at the same wage, it becomes Rs. 30.
Likewise, AVC = w / AP in that model, where AP is output per worker. These shortcuts need their assumptions: do not use wages alone to calculate all variable costs when the question separately includes clay, fuel and other variable inputs.
Three missing-value problems
1. Recover all totals from AC and AVC
At Q = 10, AC is Rs. 55 and AVC is Rs. 43. Find AFC, TC, TVC and TFC.
Start with the difference:
AFC = 55 - 43 = Rs. 12 per unit.
Then multiply by output:
- TC = 55 x 10 = Rs. 550.
- TVC = 43 x 10 = Rs. 430.
- TFC = 12 x 10 = Rs. 120.
Check: 550 - 430 = 120. Writing Rs. 12 as TFC would confuse a per-unit cost with a total.
2. Output increases by more than one unit
A different studio’s TC rises from Rs. 900 at 20 bowls to Rs. 1,080 at 25 bowls.
Cost increase = 1,080 - 900 = Rs. 180.
Output increase = 25 - 20 = 5 bowls.
Additional cost per added bowl over the interval = 180 / 5 = Rs. 36.
This is the finite-interval MC calculation. It does not tell us that every one of those five bowls individually cost exactly Rs. 36. Their individual extra costs could differ while adding to Rs. 180.
3. Rebuild TVC from MC
Suppose the first four units have MC values of Rs. 50, Rs. 35, Rs. 25 and Rs. 30. TFC is Rs. 100 and TVC at zero output is zero.
TVC at four units = 50 + 35 + 25 + 30 = Rs. 140.
TC = 140 + 100 = Rs. 240.
AVC = 140 / 4 = Rs. 35.
AC = 240 / 4 = Rs. 60.
Adding those one-unit MC values recovers variable cost. Add fixed cost separately to recover TC.
What if the fixed workshop charge rises?
Return to our original schedule. Suppose TFC rises from Rs. 120 to Rs. 180, with the same variable-cost schedule.
At six bowls, the new figures are:
- TC = 180 + 252 = Rs. 432, up by Rs. 60.
- AFC = 180 / 6 = Rs. 30, up by Rs. 10.
- AC = 432 / 6 = Rs. 72, up by Rs. 10.
- AVC remains Rs. 42.
- MC remains Rs. 52.
For the last point, the new TC at five bowls is Rs. 380. Therefore 432 - 380 still equals Rs. 52.
The TC curve shifts upward by Rs. 60 at every output. AC rises by 60 / Q, so its upward movement is larger at low output and smaller at high output. It is not a uniform vertical shift of the AC curve.
A quick graph and calculation checklist
Before handing in an answer, check these details:
- Put output on the horizontal axis. Distinguish total rupees from rupees per unit on the vertical axis.
- Start TC at TFC on the vertical axis; start TVC at zero under the stated assumptions.
- Keep the TC-TVC gap constant and the AC-AVC gap equal to AFC.
- Use the output difference in MC calculations, even when it looks obvious.
- Never draw AFC as U-shaped or claim AC must rise whenever MC rises.
- For a smooth theoretical diagram, place MC through both average-curve minima. For supplied discrete data, plot the actual values honestly.
Minimum AC also does not automatically identify maximum profit. That decision needs revenue information. You can practise that next with the guide to producer equilibrium using TR-TC and MR-MC.
Try these before reading the answers
- TC is Rs. 840 and TVC is Rs. 600 at Q = 12. Find TFC, AFC, AVC and AC.
- TC increases from Rs. 840 at 12 units to Rs. 910 at 13 units. Find MC.
- TFC is Rs. 300. What happens to AFC when output rises from 10 to 15 units?
- AC is Rs. 48 and AVC is Rs. 36 at Q = 20. Find TFC.
- TC rises from Rs. 1,200 to Rs. 1,440 when output rises from 30 to 36 units. Find additional cost per added unit.
- Five units cost Rs. 400 in total. A sixth costs an extra Rs. 50. Does AC rise or fall?
- Fixed cost rises by Rs. 90 with no change in TVC. What is the change in AC at Q = 15? What happens to MC?
- The vertical distance between AC and AVC is Rs. 8 at Q = 25. Find TFC.
Answers with a short check
- TFC = Rs. 240; AFC = Rs. 20; AVC = Rs. 50; AC = Rs. 70. The averages add: 20 + 50 = 70.
- MC = Rs. 70, because output rises by one unit and TC rises by Rs. 70.
- AFC falls from Rs. 30 to Rs. 20. TFC remains Rs. 300.
- TFC = Rs. 240. First find AFC = 48 - 36 = 12, then multiply by 20.
- Rs. 40 per additional unit over the interval: 240 / 6.
- AC falls from Rs. 80 to Rs. 75: the new TC is Rs. 450 for six units.
- AC rises by Rs. 6; MC is unchanged. Divide the Rs. 90 fixed-cost increase by 15.
- TFC = Rs. 200: AFC x Q = 8 x 25.
Frequently asked questions
1. What is the difference between TC and AC?
TC is the cost of the entire output. AC spreads that cost across the number of units produced. If six bowls cost Rs. 372 altogether, AC is Rs. 62 per bowl.
2. Is AC the same as ATC?
Yes. Here AC means average total cost, so AC and ATC refer to the same measure. AVC covers only variable cost per unit.
3. Why can MC be calculated from either TC or TVC?
The fixed charge is identical at both output levels and cancels in the subtraction. In our schedule, the move from five to six bowls adds Rs. 52 to both TC and TVC.
4. Can AC fall while MC rises?
Yes. Our MC rises from Rs. 40 to Rs. 52 between the fifth and sixth bowls, while AC falls from Rs. 64 to Rs. 62. The extra bowl still costs less than the previous average.
5. Why does AVC turn upward before AC in the usual diagram?
Falling AFC can initially outweigh rising AVC. In our example, moving from five to six bowls raises AVC by Rs. 2 but reduces AFC by Rs. 4, so AC still falls.
6. Are TC and TVC parallel?
They have a constant vertical separation equal to TFC and equal slopes at matching outputs. They need not be straight lines. Describe the constant gap when explaining a curved graph.
7. Does adding MC give TC?
Adding one-unit marginal costs from the first unit onward gives TVC when TVC at zero is zero. Add TFC to obtain TC. For unequal output intervals, multiply each interval’s per-unit increment by its output change before adding.
8. Must MC equal AC in the lowest-AC row of a table?
No. The exact equality belongs to an interior minimum of the conventional smooth curve. A discrete table may skip that point. Identify the lowest observed AC without altering the supplied figures.
9. Can AFC ever become zero?
With positive TFC and finite positive output, no. For example, spreading Rs. 120 over 1,200 bowls gives AFC of Rs. 0.10, still positive.
10. Does the minimum-cost output also give maximum profit?
Not necessarily. Lowest AC tells you where cost per unit is smallest. To find maximum profit, you must also consider what the firm earns from selling its output.
Looking for commerce tuitions?
Prachi is a gold-medalist commerce teacher with experience at Deloitte and KPMG. She focuses on fundamentals to build a strong foundation.